


I observed Balmy Alley for one hour on an October afternoon and documented all of the sights, sounds, and interactions I witnessed within that period of time. I then compiled my notes and observations into a table and categorized them into columns in order to analyze the information and extract quantitative data from it, in addition to the qualitative. Once classified, I used the columns to calculate statistical information and note patterns in the data for incorporation in my final report.

During the observation hour, I determined that traffic in the alley was approximately 50% locals, 32% residents, and 18% visitors (see next).

After conducting the observation and noticing several trends in behavior, I used the following hints - including certain factors such as point of origin, destination, travel patterns, etc. - to determine classifications in my analysis.

This is a visualization showing the density of traffic flows to and from either end of the alley, whether from the other end or within. Brush stroke direction indicates direction of travel; stroke thickness indicates the relative percentage of people who traveled in that direction.

Balmy Alley Ethnographic Observation: Final Report (p. 1/2)

Balmy Alley Ethnographic Observation: Final Report (p. 2/2)

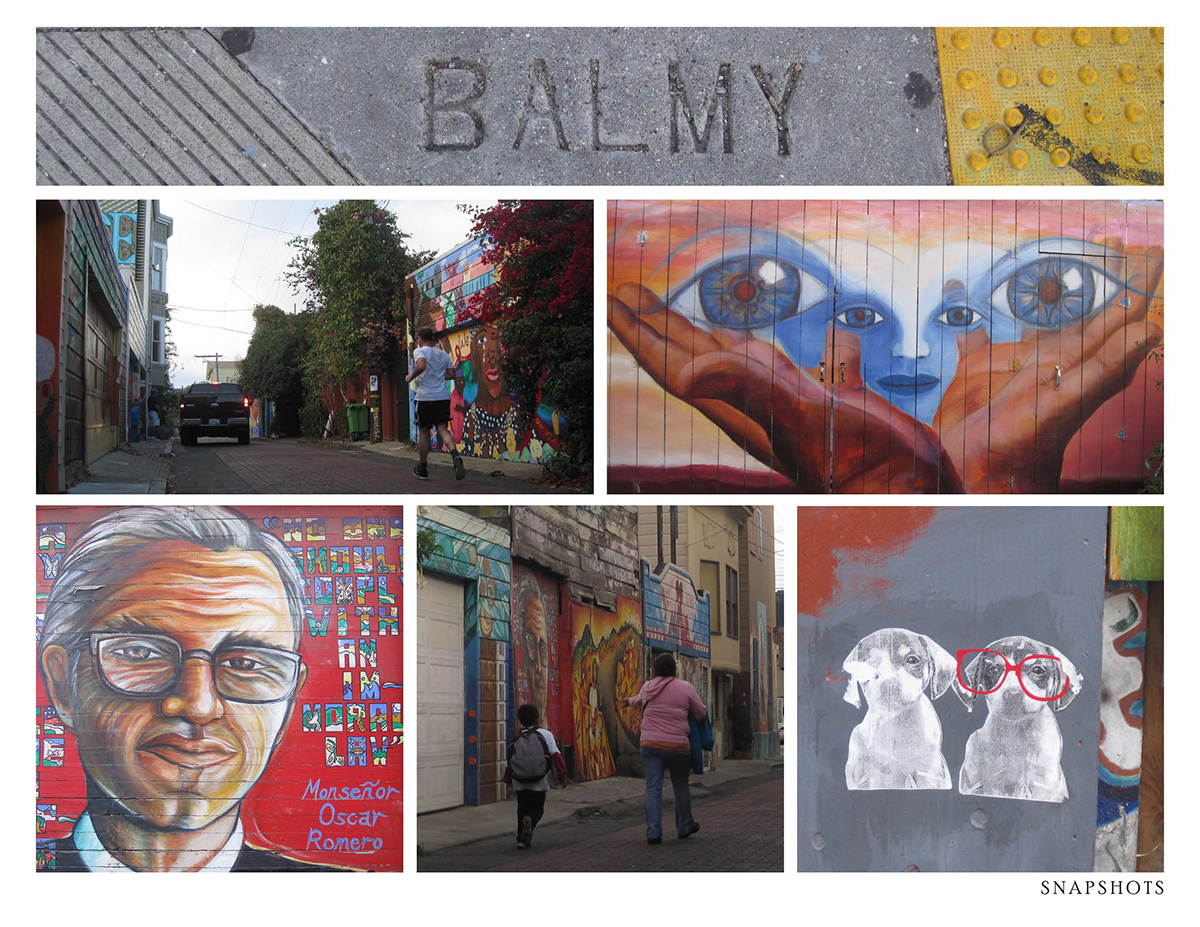
Back doors, windows, mailboxes, garage doors - covered with walls of art.


